Positioning in the Sustainable Transition Landscape
Seven years ago, the Intergovernmental Panel for Climate Change (IPCC) proposed a pathway for the global reduction of CO2 emissions, to limit the expected temperature increase to an anomaly of 2, ideally 1.5°C, by the end of this century. The CO2 emissions originate from the burning of fossil fuel, industry and land-use1 and should be rapidly reduced (>350 Mton CO2/year), while ‘negative’ CO2 emissions are gradually introduced, starting from 2030. This last strategy consists of the capture of CO2 from the air and its permanent storage under the ground or in materials, for which an 'eternal' lifetime can be assumed.
Which CO2 reduction strategies exist?
The International Energy Agency (IEA) investigated possible strategies, e.g. the more efficient use of fossil-based feedstocks and fuels in our industry and energy sector, which represents the 'low hanging fruit. They described their contribution in the CO2 reduction pathway towards a net-zero CO2 emission in 20702. In parallel, the IEA elaborated a more stringent roadmap, to achieve a net-zero emission by 2050. Important examples of such strategies are electrification, green hydrogen production, the use of renewable feedstocks and CCUS (incl. storage of captured CO2). Together, they lead to a cumulative yearly reduction of CO2 emissions by 35 Gt in 2070.
On which CO2 reduction strategy should we focus?
Part of the proposed sustainable strategies rely on the use of renewable electricity. If we take into account a local scarcity of renewable electricity today and in the future, strategies should be prioritized. A first fair set of criteria would simply consist of the 'MWh of renewable electricity' or 'the EURO's' invested in a strategy, in order to reduce the yearly emission by given ton of CO2. In addition, the anticipated potential for CO2 reduction, related to the market size of given CO2-based fuel, chemical or other products, should be included in the screening. Last but not least, the corresponding renewable electricity required to supply such a market could even become the most important criterium.
However, the former criteria may not suffice and other factors should be taken into consideration in such a decision-making framework: the application's 'readiness level', with regards to the technology development, its deployment in the market, compatibility with the existing energy and industrial system, amongst others. Also, possible local synergies between stakeholders, legislative frameworks to close possible financial gaps in the business case, availability of infrastructure, geography for deployment should not be overseen. To conclude such screening, the strategies should be ranked not only within, but also between different sectors, such as energy production, buildings, mobility and industry. As internationally active research institute, the Flemish Institute for Technological Research (VITO) combines its competences to tackle these cross-border, cross-sector and cross-vector challenges, within the field of CCU.
How to evaluate value chains, that rely on CO2 feedstock, in practice?
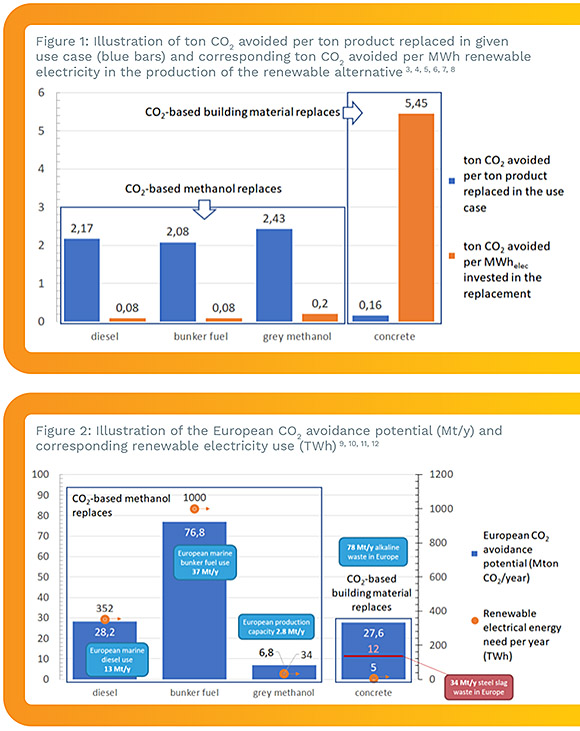 Three CCU-based value chains were assessed by VITO. They all start from the capture of fossil-based, postcombustion CO2 from chimneys. It is used as feedstock in the production of CO2-based products, alongside the application of zero-carbon energy to fulfill the process' electricity need. In a next step, they are replacing a fossil-based product in one or more use cases:
- CO2-to-fuel route: To deliver an equal amount of energy 2.25 ton CO2-based methanol can replace 1 ton diesel or 1.07 ton bunker fuel in the marine fuel combustion.
- CO2-to-chemicals: the production of 1 ton grey methanol is replaced by 1 ton CO2-based methanol in the chemical industry.
- CO2-to-building material: the production is based on the spontaneous reaction of stainless steel slags or other alkaline (waste) material with the CO2 gas, forming an alternative for the classical cement binder. This implies a permanent CO2 fixation. The resulting product replaces concrete-based building materials, which are based on cement. The process of cement production emits significant quantities of CO2.
The following conclusions can be drawn from resp. Figure 1 and 2:
- In the marine fuel and chemical use cases, the replacement by CO2-based methanol results in a factor 15 higher CO2 reduction potential than in the building material case. However, the production of methanol requires large amounts of electricity. Conversely, the corresponding CO2 reduction potential per unit of renewable electricity, applied in the CO2-to-methanol conversion process, is significantly lower.
- The total replacement of European marine fuel results in a CO2 reduction potential in the range of 100 Mton CO2/year. This is a factor 15 higher than in the smaller chemical use case, related to the European methanol production capacity. The building material use case also shows a significant potential, based on the availability of alkaline waste material in Europe. As a yearly renewable energy production of 3400 TWh is anticipated in Europe by 20504, the European marine fuel use case becomes restricted by its yearly renewable electricity need of 1000 TWh.
It is clear that no unambiguous selection of a viable scenario can be made in this exercise, focusing on only the CO2 reduction potential and one use case, in extremis. A balanced combination of different CCU strategies is preferable. It starts from the current and future availabilities of renewable electricity as conditio sine qua non, with deployments spread over time.
The production of CO2-based fuels with electrified systems can support the renewable energy transition in an energy storage strategy.
The production of CO2-based building materials is a feasible short-term pathway, if proper supply chains for alkaline waste feedstock can be guaranteed. In the meantime, opportunities arise in the field of energy import, which influences the boundary conditions for CCU: Renewable electricity can be produced in an economic feasible way, at far locations in the world, where solar and wind energy are abundant. In such scenarios, CCU not only serves as a storage strategy for the low-carbon and low-cost energy, but also facilitates its transport towards Europe, in the form of molecules with a high energy density.
Indeed, the role of methanol as fuel or platform chemical could then be extended to an 'easy-to-transport' liquid energy carrier.
Therefore, VITO concludes that the positioning of CCU within the Sustainable Transition Landscape not only rests on many, different pillars, but also on global trends and the dynamic nature of its boundary conditions.
1) Anderson, K.; Peters, G., Science 354 (6309), 2016, 182–183.
2) https://iea.blob.core.windows.net/assets/181b48b4-323f-454d-96fb-0bb1889d96a9/CCUS_in_clean_energy_transitions.pdf
3) CRI process with 75% H2 prod. efficiency: 11.8 MWh/t MeOH and 1.38 t CO2/t methanol [see (5)], incl. capture: heat use = 1178 MWh/t CO2 → 0.44 t/t methanol @ 0.27 t CO2/MWh, elec. use = 196 kWh/t CO2, DSP = 0.33 t CO2/t methanol
4) Dechema Technology study (2017): Low carbon energy and feedstock for the European chemical industry
5( per t Carbstone: 480 kg SSS, 480 kg sand, 107 kg water, 92 kg CO2, drying 63 kWh heat, mixing electricity 27 kWh, curing electricity 2 kWh , footprint extracted from LNE study see below
6) https://www.epa.gov/sites/production/files/2015-07/documents/emission-factors_2014.pdf, from CO2 emission factor list
7) https://www.egcsa.com/wp-content/uploads/CO2-and-sulphur-emissions-from-the-shipping-industry.pdf, https://www.engineeringtoolbox.com/co2- emission-fuels-d_1085.html
8) LNE study (2016): Onderzoek naar mogelijk ondersteuningsbeleid m.b.t. nieuwe toepassingsmogelijkheden van CO2 als grondstof
9) https://www.concawe.eu/wp-content/uploads/2017/01/marine_factsheet_web.pdf
10) https://www.icis.com/explore/resources/news/2019/01/31/10313703/chemical-profile-europe-methanol , 2019 data.
11) https://www.eurofer.eu/assets/Uploads/European-Steel-in-Figures-2020.pdf , total slag utilization 34.1 Mt in 2019
12) https://www.science.org/content/article/industrial-waste-can-turn-planet-warming-carbon-dioxide-stone , extrapolation of 43.5% steel slag contribution on global level to European market of alkaline waste materials (fly ash, cement waste, ...) and taking into account a similar stoichiometry of alkaline waste/CO2 in building material, as for the Carbstone building material